This image is for illustration purposes only.

This image is for illustration purposes only.

'Add Questions' tab. This image is for illustration purposes only.

'Manage Questions' tab. This image is for illustration purposes only.

Test 'Preview' view.

This image is for illustration purposes only.

This image is for illustration purposes only.
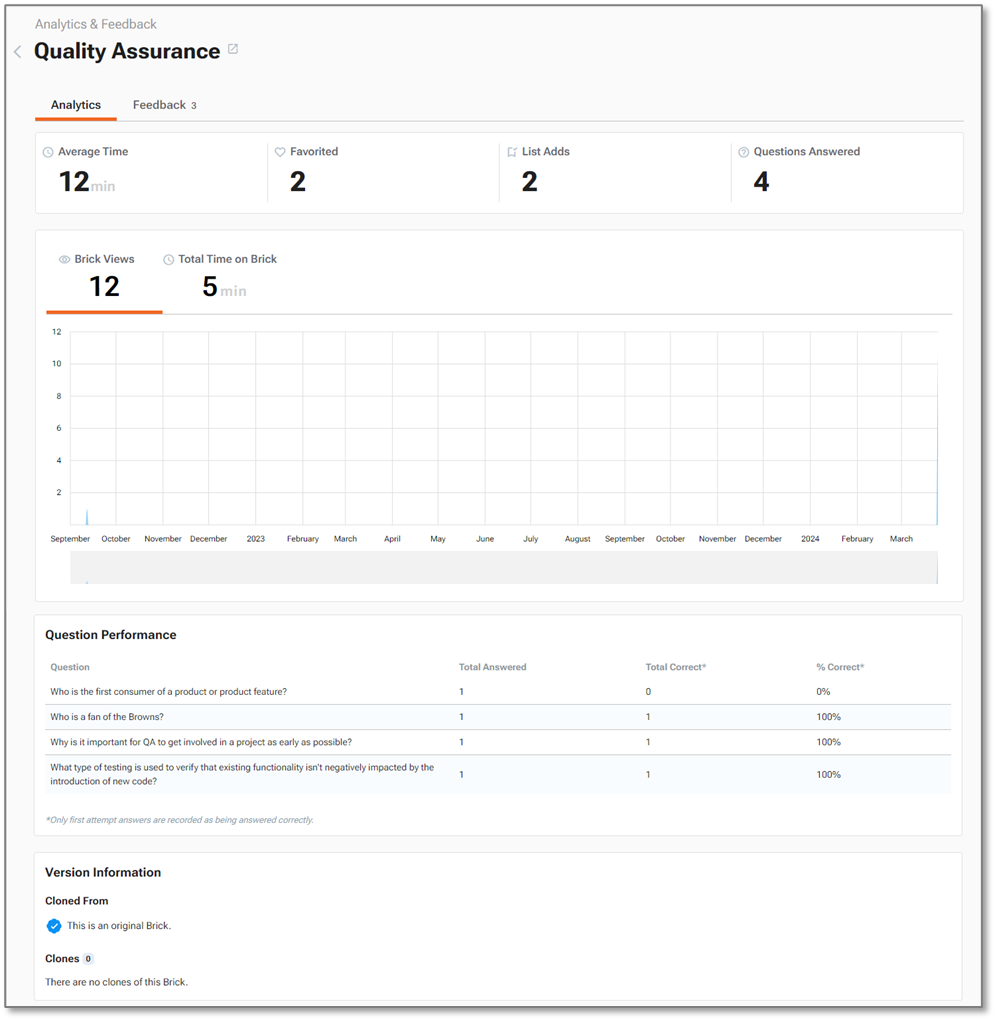
The ‘Questions Answered’ metric reflects the total number of questions answered. It is calculated by multiplying the total number of questions by the count of distinct readers who have answered the questions.
For instance, if a brick contains four questions and ten readers answer all four questions, the display will show ‘40’.
Note: Only the reader’s initial answer is counted; if they change their answer multiple times, it is still only counted once per question.
| | Brick Views |The ‘Brick Views’ metric displays the number of non-distinct brick views.
Example: If the same reader views the brick ten times, it is counted as ten views.
| | Total Time on Brick | The ‘Total Time on Brick’ metric reflects the total amount of time spent on the brick by all **authenticated** readers. Brick views for unauthenticated readers are not included in this metric. | | Question Performance | The ‘Question Performance’ metric reflects the total number of times **authenticated** readers have answered the question. | | Version Information |The ‘Version Information’ section provides the following information related to the brick:
Cloned From. When a brick is cloned, the original brick title displays; otherwise, it indicates that it is an original brick.
Clones. Displays the number of times the brick has been cloned.
|

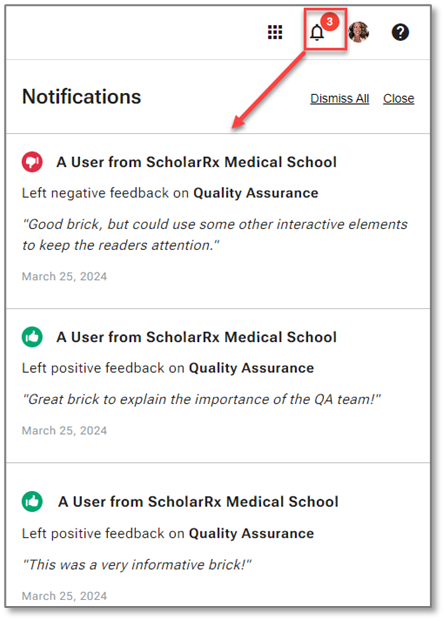
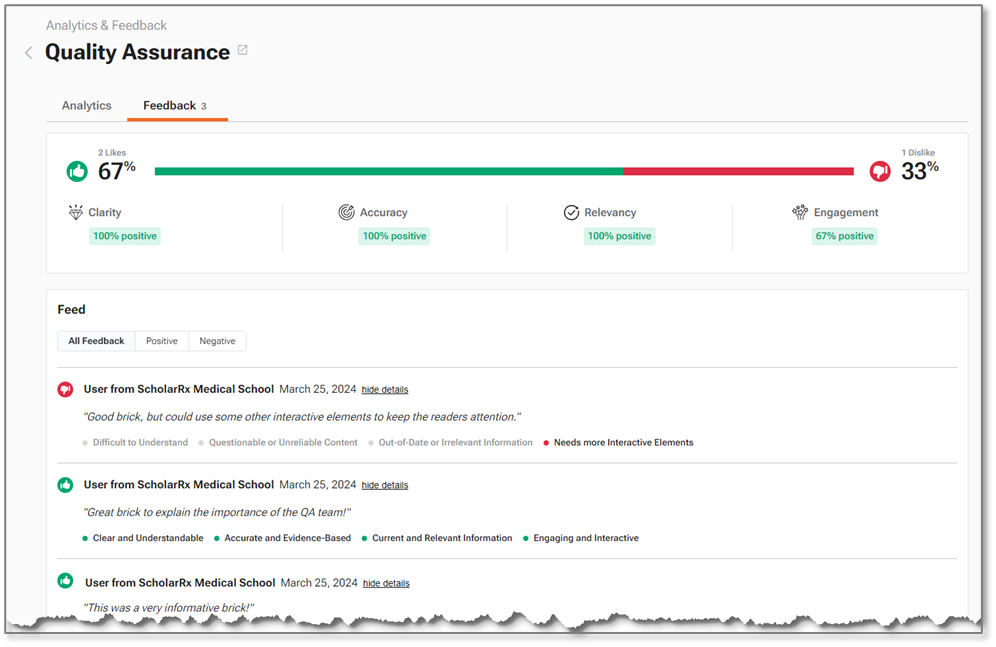
Analytics & Feedback -> Feedback tab
Analytics. Provides analytics about the brick being viewed.
Feedback. Provides detailed feedback about the brick being viewed. This tab also displays a count for the number of feedback items.
| | Likes/Dislikes Bar |The Likes/Dislikes bar shows the total number of likes (green) vs. the total number of dislikes (red), along with a percentage calculation.
Calculation: total number of likes or dislikes / total number of feedback.
| | | **Clarity**. When a reader selects ‘Clear and Understandable’ during the feedback process, this is translated into the Clarity percentage rating. | | | **Accuracy**. When a reader selects ‘Accurate and Evidence-Based’ during the feedback process, this is translated into the Accuracy percentage rating. | | | **Relevancy**. When a reader selects ‘Current and Relevant Information’ during the feedback process, this is translated into the Relevancy percentage rating. | | | **Engagement**. When a reader selects ‘Engaging and Interactive’ during the feedback process, this is translated into the Engagement percentage rating. | | Feedback |The Feedback section displays all feedback pertaining to the selected brick. Feedback is broken out into three tabs.
All Feedback. Displays all positive and negative feedback and associated comments.
Positive. Only displays positive feedback and associated comments.
Negative. Only displays negative feedback and associated comments.
The feedback displays feedback options selected by the reader as well as any additional comments entered in the feedback free-form text field.
| | Hide/Display Details | By default, feedback is displayed with details; however, you can click the ‘hide details’ option next to any feedback to suppress it. | ## Enhancements Enhancements represent items that have been added to the software to increase usability. ### Bricks Create #### Restyled ‘My Bricks’ page Based on our customer feedback, we have restyled the ‘My Bricks’ page. Restyling a page is not just about aesthetics; it directly impacts usability and customer satisfaction. By optimizing visual elements & streamlining navigation, information is more easily discoverable and accessible.
Original ‘My Bricks’ page

Updated 'My Bricks' page
When clicked, only the bricks that you own display on the page. The number to the right represents the total number of bricks you have authored.
Note: You may see other author's names on the bricks on this page. This occurs when a brick ownership is transferred to you, but the author's name is not modified.
| | ‘All Team Bricks’ tab | When clicked, all bricks associated with your institution are displayed on the page. The number to the right represents the total number of bricks related to the institution. | | Filter options |When clicked, the following filter options are displayed.
Last Updated. When clicked, bricks are sorted by the last updated date, in descending order. This is the default view.
Most Viewed. When clicked, bricks are sorted by most viewed, in descending order.
Most Likes. When clicked, bricks are sorted based on the highest number of liked (thumbs up) bricks, in descending order.
Most Dislikes. When clicked, bricks are sorted based on the highest number of dislikes (thumbs down) bricks, in descending order.
Precent Liked. When clicked, bricks are sorted based on the highest percentage of likes (thumbs up), in descending order.
Percent Disliked. When clicked, bricks are sorted based on the highest percentage of dislikes (thumbs down), in descending order.
| | Brick thumbnails |If a brick thumbnail has already been added, it will display. To update it, click the image again.
If a brick thumbnail has not been added, you may add one by clicking on the thumbnail placeholder.
| | Brick title | Displays the name of the brick. | | Author name(s) | ‘Author’ name(s) now display beneath the brick title. | | Brick duration | Brick duration displays next to the author’s name. | | Listing type |Displays the listing type. Options include:
Listed. Can be searched for and returned in search results on the Exchange.
Unlisted. Cannot be searched for and will not be returned in search results on the Exchange.
| | Views | Displays the total number of non-distinct brick views, including anonymous user views. | | Likes (vs dislikes) | The likes vs. dislikes percentage is based on the total feedback / # of likes or dislikes; however, only the total number of ‘likes’ display beneath the percentage. | | Analytics & Feedback icon | The new Analytics & Feedback page can be accessed by clicking on the Analytics & Feedback icon. | | Ellipses menu options |Multiple menu options can be found by clicking on the ellipses. These options provide a method for the user to quickly:
• Copy brick links
• Preview the brick
• Clone the brick
• Manage the brick privacy
• Transfer brick ownership
• Delete the brick
Note: These options are not new for this release.
| #### Restyled ‘My Annotations’ page The ‘My Annotations’ page now only displays the brick name and a link to the brick on the Brick Exchange, resulting in a more streamlined experience.
Original 'My Annotations' page

Updated 'My Annotations' page
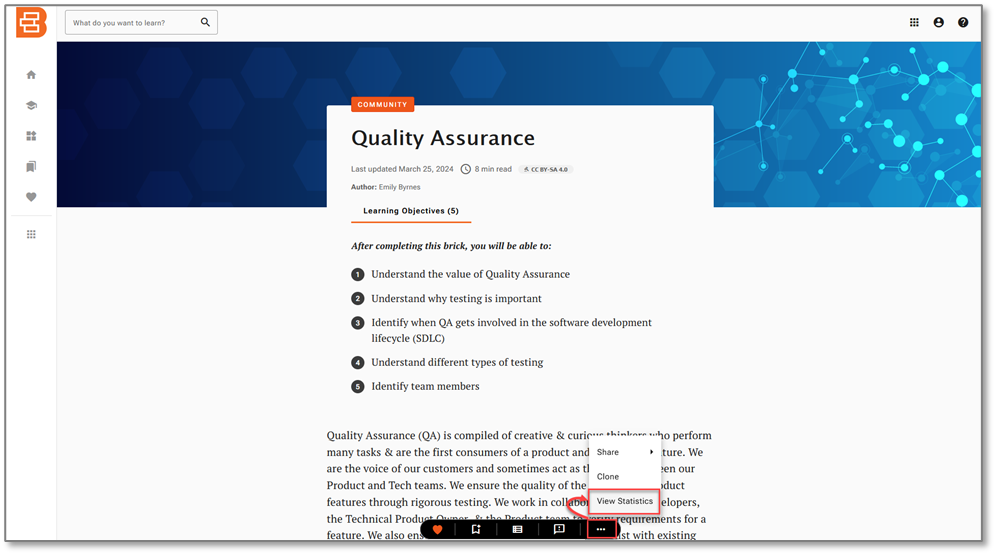
'View Statistics' option on the bottom of the brick
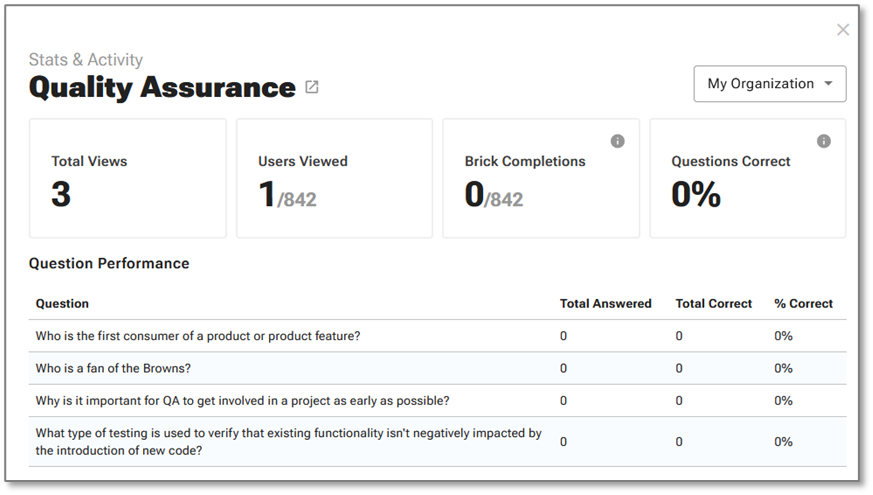
Brick specific statistics page

'My Bricks' page -> Analytics & Feedback icon

Analytics & Feedback page -> Analytics tab

